How To Become More Self-Sufficient Without Starting a Full-Blown Farm…
Want to start preserving your harvest, making your own soap, or building a backyard root cellar — but not sure where to begin? “Homesteading Advice” gives you instant lifetime access to 35+ practical homesteading books on food preservation, veggie gardening, DIY natural cleaning products (save over $250 per year with this skill alone), brewing, off-grid energy, and a whole lot more…
Click Here To Check It Out Now!
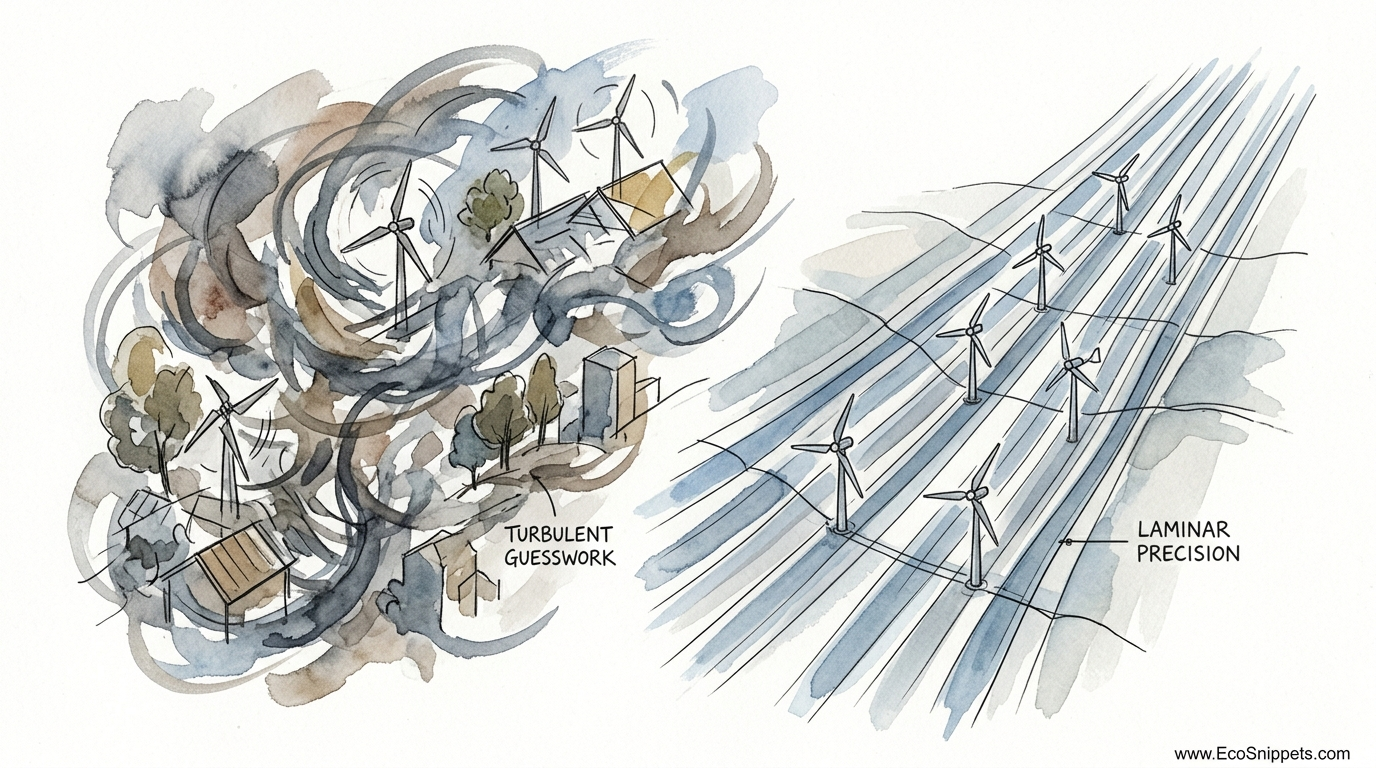
Moving your turbine just ten feet to the left could double your power output – if you know where the wind actually lives. Wind power is all about ‘Laminar Flow.’ If you place your turbine where air is tumbling over obstacles, you’ll get vibration instead of volts. Learn how to use a simple data-logger to map your land’s energy corridors before you ever pour a drop of concrete for a tower.
Generating your own power is the ultimate act of self-reliance, yet many people rush into wind energy with more enthusiasm than information. They buy a turbine, bolt it to a pole, and wonder why the blades barely turn while the neighbor’s trees are swaying. The secret isn’t always a bigger turbine; it is often the placement. You are looking for ‘laminar’ air—smooth, predictable, and fast—rather than ‘turbulent’ air that has been shredded by trees, barns, or hills.
Mapping your land’s wind corridors allows you to transition from TURBULENT GUESSWORK to LAMINAR PRECISION. By understanding the invisible rivers of energy flowing over your acreage, you can ensure your investment pays off in usable watt-hours rather than broken components and frustration. This guide will walk you through the process of reading your land like an open book.
How To Map Wind Corridors For Diy Turbines
A wind corridor is a path through the landscape where air flow is concentrated and accelerated by the surrounding terrain. Think of it like water in a stream; when the banks narrow or the water flows over a smooth ledge, it speeds up. On your property, these corridors might be formed by the gap between two hills, a long stretch of flat pasture, or the space between a treeline and your house. Mapping these areas means identifying where the wind is fastest and most consistent throughout the year.
To do this effectively, you must understand the Cube Law of Wind. In simple terms, the power available in the wind is proportional to the cube of its speed. If you move your turbine from a spot with 10 mph (16 km/h) wind to a spot with 12 mph (19 km/h) wind, you haven’t just gained a 20% increase in speed; you have nearly doubled the potential power output. This is why mapping is not just a suggestion—it is a financial and mechanical necessity.
In the real world, corridors are mapped using a combination of visual observation, topographical study, and mechanical data logging. You are searching for the path of least resistance. Wind hates “roughness.” Every tree, fence, and building creates a wake of turbulent, slow-moving air behind it. Your goal is to find the “sweet spot” where the air has had enough space to smooth out and regain its velocity after hitting an obstacle.
The Tools of the Trade: Gathering Data
To map your land properly, you need more than just a finger in the air. Professional site assessments use meteorological masts (met-masts) that stand 30 to 50 meters (100 to 165 feet) tall, but for a DIY homesteader, you can achieve excellent results with scaled-down versions of these tools. You are looking to measure two primary things: wind speed and wind direction.
Anemometers: The Wind Speed Sensor
An anemometer is the heart of your mapping kit. There are two main types suitable for DIY use: cup anemometers and ultrasonic anemometers. Cup anemometers are the traditional choice; they use three or four small cups that spin in the wind. They are rugged, easy to understand, and generally more affordable. Ultrasonic anemometers have no moving parts and use sound waves to measure speed, which makes them excellent in freezing conditions where ice might jam a mechanical cup.
Data Loggers: The Memory of the Wind
An anemometer only tells you what the wind is doing right now. To map a corridor, you need to know what it does at 2:00 AM on a Tuesday or during a summer thunderstorm. A data logger connects to your anemometer and records measurements at set intervals—usually every minute or every ten minutes. Many modern loggers, like the Rainwise WindLog or APRS World units, store data on an SD card that you can later plug into a computer to generate charts and graphs.
Temporary Masts
You shouldn’t measure wind speed at ground level. Ideally, you should measure at the height you intend to mount your turbine. For most DIY setups, this is between 30 and 60 feet (9 to 18 meters). You can use a temporary “telescoping” mast made of galvanized steel pipe or a heavy-duty flag pole. This allows you to move the sensors around different parts of your property over several weeks to compare “Candidate Site A” with “Candidate Site B.”
How It Works: The Mapping Process Step-by-Step
The process of mapping wind corridors involves shifting from general observations to specific data points. You don’t need a degree in meteorology, but you do need patience. Most experts recommend collecting data for at least six to twelve months to capture seasonal variations, but you can see significant patterns in as little as 30 days.
Step 1: Topographical Analysis
Start by looking at a topographical map of your property. Look for “funnels” where the land slopes downward toward a central point or ridges that stand higher than the surrounding terrain. Wind naturally accelerates as it is forced over a ridge or through a gap. Mark these as your primary “areas of interest.” Note the prevailing wind direction for your region; in many parts of the Northern Hemisphere, wind comes predominantly from the West or Northwest.
Step 2: Identifying Obstacles
Walk your land and identify every major obstacle. A “major obstacle” is anything taller than 15 feet (4.5 meters), such as houses, barns, or mature trees. For every obstacle, there is a “turbulence zone” that extends far downwind. A good rule of thumb is that turbulence can persist for a distance of up to 20 times the height of the object. If you have a 30-foot (9-meter) tall barn, the air behind it may be “dirty” for 600 feet (183 meters).
Step 3: Deploying the Sensors
Place your temporary mast at your most promising site. Ensure the anemometer is at least 30 feet (9 meters) higher than any obstacle within a 500-foot (150-meter) radius. This is often called the “30/500 rule.” If you cannot get that high, you must accept that you will be measuring more turbulence. Set your data logger to record average speed, maximum gusts, and direction.
Step 4: Analyzing the Rose
Once you have a month of data, look at a “Wind Rose” diagram. This is a circular chart that shows how often the wind blows from each direction and at what speeds. If your Wind Rose shows that 80% of your power-producing wind comes from the West, but there is a massive grove of oaks 100 feet to your West, you know that your “Site A” is compromised by turbulence, even if the average speeds seem high.
Benefits of Mapping Before Building
The primary benefit of mapping is the avoidance of catastrophic failure. Wind turbines are mechanical devices with moving parts that are subject to extreme stress. Turbulent air doesn’t just reduce power; it causes the turbine to “yaw” or hunt back and forth as it tries to find the wind. This puts massive lateral stress on the bearings and the tower, often leading to premature failure.
Other benefits include:
- Accurate ROI Projections: You will know exactly how much energy you can expect to harvest, allowing you to calculate how long it will take for the system to pay for itself.
- Optimized Tower Height: Data might show that increasing your tower height by just 10 feet (3 meters) would move your turbine out of a turbulence layer and into a laminar flow, potentially doubling your output.
- Informed Turbine Selection: Different turbines are designed for different wind regimes. High-speed, three-blade turbines need smooth air, while some vertical axis turbines (VAWTs) handle turbulence slightly better. Your data will tell you which one to buy.
Challenges and Common Mistakes
One of the most frequent mistakes is short-term measuring. Wind is notoriously fickle. A week of “great wind” might just be a passing weather system that doesn’t represent the rest of the year. If you base your tower location on a single storm, you might find that for the other 51 weeks of the year, that spot is a dead zone.
Another challenge is ground friction. Air near the ground is slowed down by the “roughness” of the earth’s surface. Beginners often mount anemometers too low, leading them to believe their property has no wind resource. This is why the “30/500 rule” is so critical. You are looking for the wind that lives in the sky, not the wind that brushes the grass.
Finally, many DIYers ignore directional shifts. A corridor that works perfectly in the winter might be completely blocked in the summer when the trees fill with leaves. If you only map during the winter, you are only seeing half the picture. The density of leaves in a forest can change the “roughness” coefficient of your land significantly.
Limitations: When This May Not Be Ideal
Mapping may not be ideal—or even possible—in densely populated urban environments. In a city, the “roughness” of the terrain is so high that finding laminar flow is almost impossible below 100 feet (30 meters). In these cases, the “corridors” are so fragmented by buildings that the wind becomes “chopped” air, which provides very little usable energy and high mechanical wear.
Environmental constraints also play a role. If your only viable wind corridor is directly over a protected wetland or through a neighbor’s view-shed, the data doesn’t matter; you won’t be able to build there. Furthermore, if your property is at the bottom of a deep, narrow canyon, the “thermal” winds might be predictable, but the overall wind power density might be too low to justify the cost of a turbine, no matter how well you map it.
Comparing Approaches: Precision vs. Guesswork
When deciding how to site your turbine, you are essentially choosing between LAMINAR PRECISION and TURBULENT GUESSWORK. The following table illustrates the differences in the long-term outcome of these two philosophies.
| Feature | Turbulent Guesswork (Siting by Sight) | Laminar Precision (Data Mapping) |
|---|---|---|
| Initial Cost | Zero (Free) | $200 – $600 (Sensors/Logger) |
| Power Output | Unpredictable, often low | Optimized (often 2x – 3x higher) |
| Maintenance | High (Vibration leads to wear) | Lower (Smooth operation) |
| Component Life | 3 – 5 Years (Estimated) | 10 – 20 Years (Estimated) |
| Success Rate | Low (Often abandoned) | High (Reliable power) |
Practical Tips for Accurate Mapping
Start your mapping project by observing the vegetation on your land. Trees that lean in one direction, or have branches primarily on one side (known as “flagging”), are natural anemometers. They show you the direction and intensity of the prevailing winds over decades. Use these “ancestral markers” to place your first temporary test mast.
When setting up your logger, use a 1-second sampling rate with a 10-minute average recording. This means the logger looks at the wind every second to find the peak gust, but only writes one line of data every ten minutes. This prevents your SD card from filling up too quickly while still capturing the “gustiness” of the wind, which is a key indicator of turbulence levels.
- Keep a Logbook: Note when you clear brush or when a neighbor builds a new shed. These things change your wind corridor.
- Battery Management: If using a remote logger, ensure you have a small solar panel to keep the batteries topped off, especially in winter when cold kills battery life.
- Double Check Height: Use a rangefinder or a simple clinometer to verify that your anemometer is truly 30 feet (9 meters) above the local obstacles.
Advanced Considerations: Wind Shear and Density
For those serious about maximizing their harvest, consider measuring Wind Shear. This involves placing two anemometers on the same mast: one at 30 feet (9 meters) and one at 60 feet (18 meters). The difference in speed between these two heights tells you how “rough” the ground is. A high shear exponent means the wind is being significantly slowed by the ground, suggesting you need a much taller tower to reach the “clean” air.
You should also factor in Air Density. Wind power density is calculated as $1/2 \times \rho \times V^3$, where $\rho$ (rho) is the air density. If you live at a high elevation, like the Rocky Mountains (2,000+ meters / 6,500+ feet), the air is thinner and contains less energy than air at sea level. Your mapping data should be adjusted for your local altitude and average temperature to get a true “Watts per square meter” value for your corridors.
Example Scenario: The Valley Funnel
Imagine a homesteader in a valley that runs North-to-South. The prevailing winds in the region are from the West. Initially, the owner wants to put the turbine on a small knoll near the house because it’s convenient for wiring. However, after three months of mapping, the data shows the wind at the knoll is highly turbulent because it is “tumbling” over the western ridge of the valley.
The owner moves the test mast to a location 200 feet (60 meters) further South, where a small gap in the western ridge allows the wind to “leak” through. The data at this second site shows an average wind speed of 11 mph (17.7 km/h) compared to 8 mph (12.8 km/h) at the first site. Using the Cube Law, the power potential at the second site is more than 2.5 times higher than the first. By mapping the corridor, the owner saved thousands of dollars and ensured the turbine would actually perform.
Final Thoughts
Mapping wind corridors is a return to a more observant way of living. It requires you to watch the shadows, the sway of the trees, and the movement of the clouds. While the tools are modern—silicon chips and digital sensors—the goal is as old as the first windmill: to align ourselves with the natural forces of the earth rather than fighting against them.
Investing time in a site assessment is the hallmark of a serious practitioner. It separates those who “have a turbine” from those who “harvest power.” By identifying the laminar corridors on your property, you ensure that every drop of concrete and every foot of wire is working toward your independence.
Once you have mapped your corridors, you will find that your relationship with your land has changed. You will no longer just see a field or a hill; you will see a dynamic landscape of energy. This knowledge is the foundation of a resilient, self-sustaining homestead that will provide for you and your family for years to come.
